


We're currently experiencing technical issues with the REcore dashboard. REcore is working diligently to restore service as quickly as possible. Thank you for your patience and understanding.
Available at no additional cost:
Products available at a discounted rate
Additional Resources
Contact Us
Phone & Chat Hours
(English & Spanish)
Monday – Friday:
8:30 AM – 9:00 PM
Saturday – Sunday:
8:30 AM – 5:00 PM
Our Live Chat and Submit a Ticket options have moved! To contact our Support Team, please click the buttons below.
Available at no additional cost:
Available at a discounted rate negotiated by CRMLS
Additional Resources
Contact Us
Phone & Chat Hours
(English & Spanish)
Monday – Friday:
8:30AM – 9:00PM
Saturday – Sunday:
10:00 AM – 5:00 PM
Our Live Chat and Submit a Ticket options have moved! To contact our Support Team, please click the buttons below.
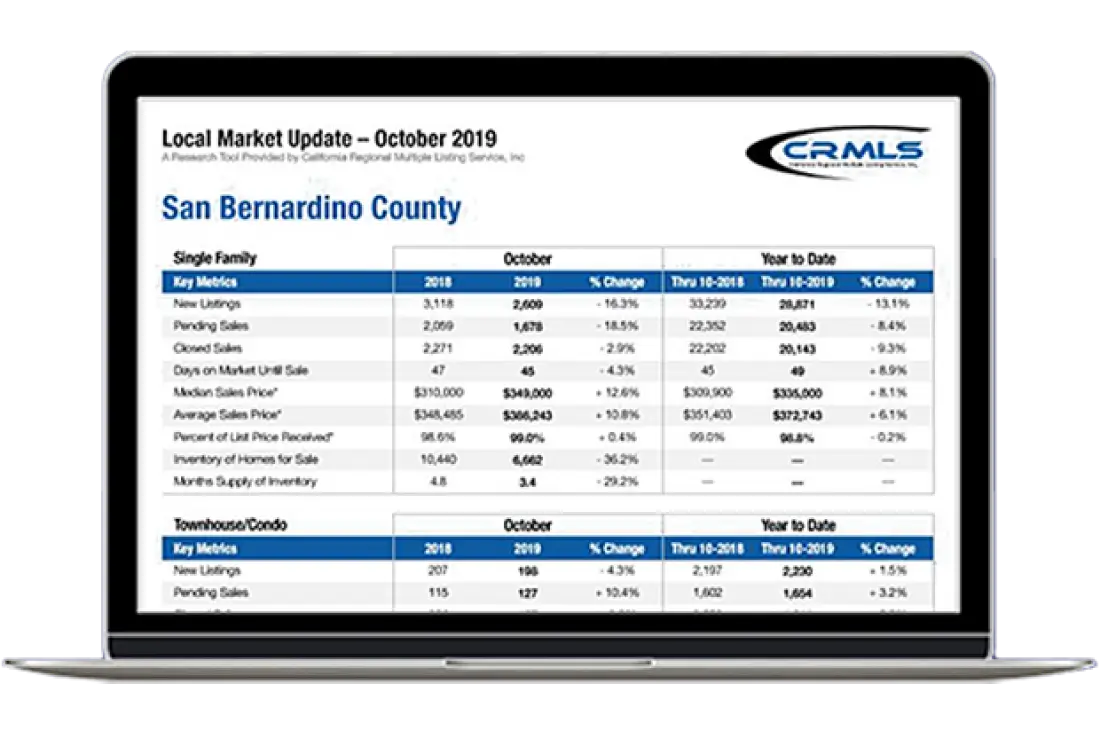
Understanding the market, from the local to the national level, can be a difficult thing for the average consumer. With InfoSparks, you can demystify the numbers and show your complete grasp on trends and forecasts. By sourcing from the latest MLS data, InfoSparks gives the most up-to-date property snapshot so you and your clients can make the most informed decisions.
To access InfoSparks, log in to your REcore dashboard and select the "Manage Apps" button on the right.
Navigate to the "Core Products" section, then select the "InfoSparks" tile.
From there, you’ll be directed to the
InfoSparks registration page.
Regional analysis made with real-time data
Compare your performance against other local professionals to emphasize your expertise
Centralize all your reports in one map-based interface
ShowingTime InfoSparks
Click HereInfosparks Market Statistics Webinar
Click HereMarketView reports provide agent, broker, and firm variables. Compare your performance against other local professionals to emphasize your expertise, knowledge, and sales activity to your current and potential clients.
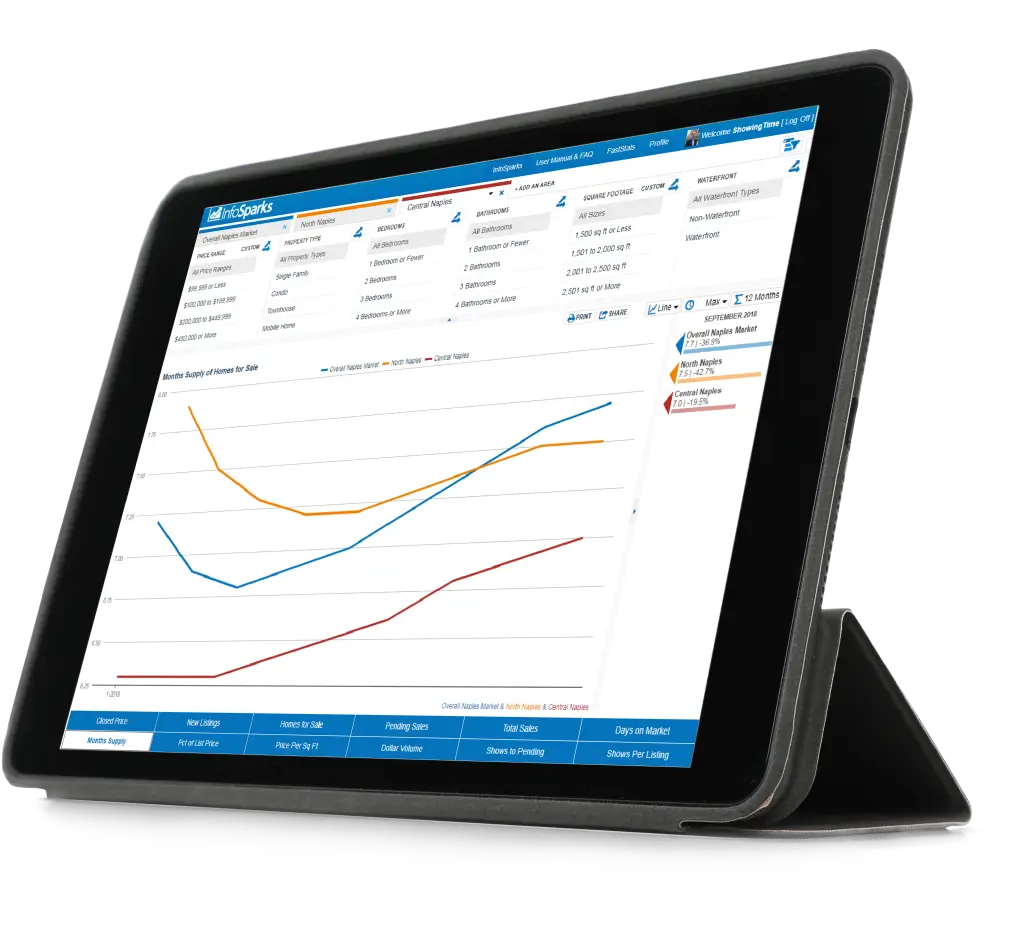
FastStats is a tidy, map-based interface that centralizes all your reports in one place, including local market updates, monthly indicators, annual reports, and more.
Log in to your dashboard to get started with InfoSparks.
InfoSparks’ market analysis reports are easily viewed on both desktop and mobile devices in colorful, sleek, easy-to-read charts and graphs. Share reports with your clients effortlessly via email, social media or print, or embed live-updating statistics on your website. Advanced users can collect raw data in CVS format.